Data is powerful — but only when we know how to use it.
আজকের পৃথিবীতে data আছে সব জায়গায়। প্রতিটি click, transaction, interaction —
সবকিছুই data। কিন্তু Data থাকা আর data ব্যবহার করতে পারা — এক জিনিস না।
অনেক organization data collect করে, dashboard বানায়, report generate করে,
তবুও expected growth আসে না। কারণ তারা focus করে tools-এ, decision-making-এ না।
একটা Food delivery business-এর কাছে massive data ছিল। তারা জানতো peak order
time, popular locations এবং top restaurants। তবুও customer complaints
বাড়ছিল। Deep analysis করে দেখা গেল, রাত ৮টা–১০টা ছিল highest demand-এর সময়,
আর একই সময় delivery সবচেয়ে slow ছিল। Late delivery-এর কারণে customer
satisfaction কমে যাচ্ছিল। তখন problem এবং cause—দুটোই clear হয়ে গেল।
এরপর business decision নিল peak hour-এ rider increase করবে এবং high-demand
zone-এ smart positioning করবে। এর ফলাফল ছিল faster delivery, better customer
experience এবং আরও বেশি repeat orders।
Insight vs Data
Data: "Sales কমেছে 15%"
Insight: "Sales কমেছে কারণ weekend traffic কমেছে"
Decision: "Weekend promotion চালু করলে sales recover হবে"
একজন Data Analyst হিসেবে আমাদের কাজ শুধু chart বা dashboard বানানো না।
আমাদের আসল কাজ হলো data insight-কে business action-এ convert করা।
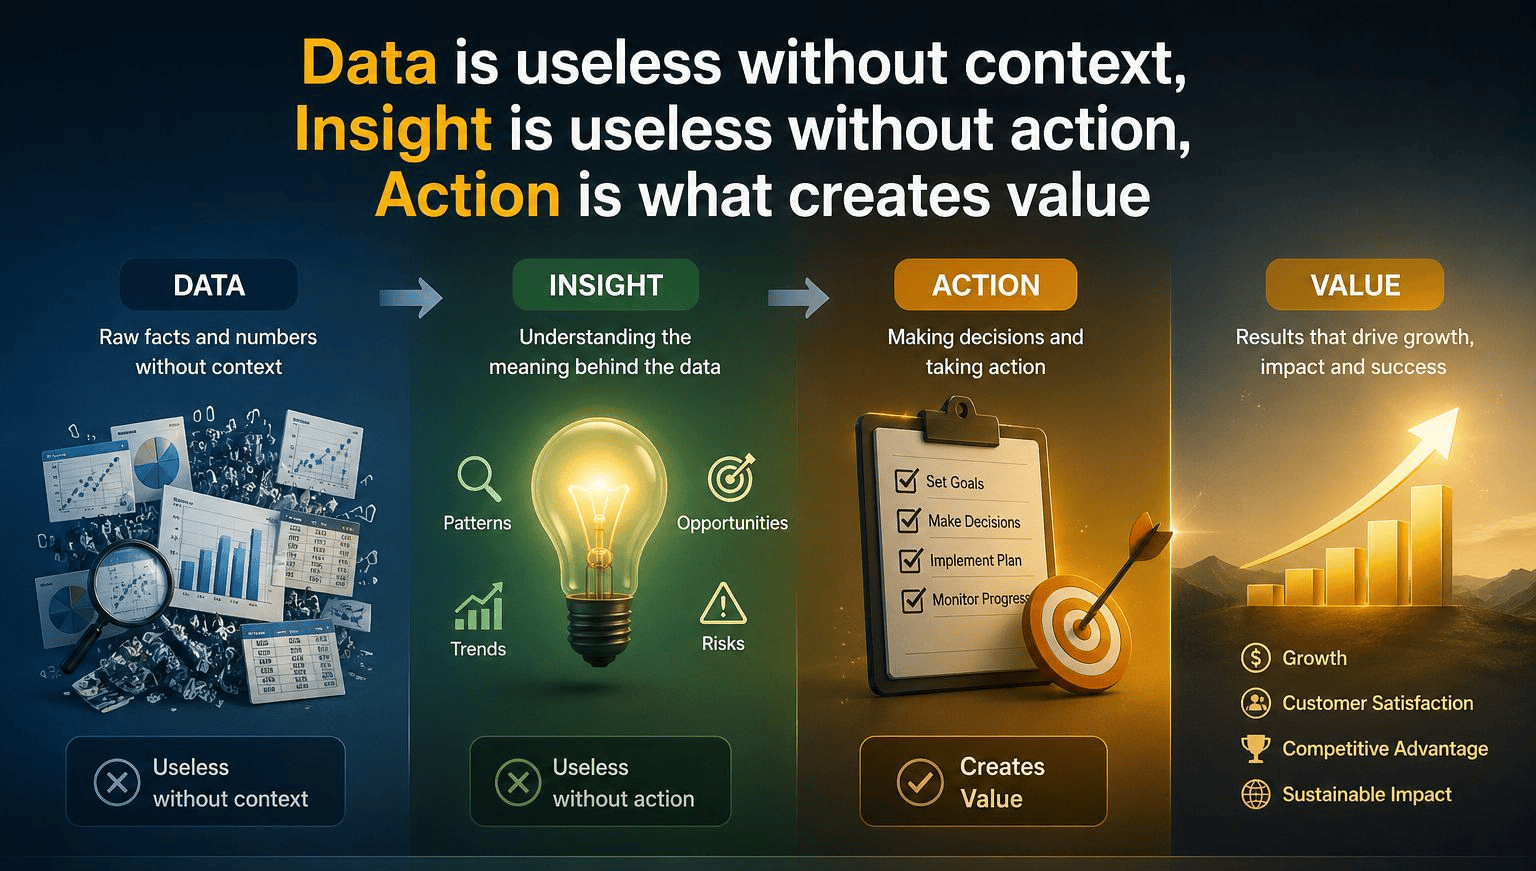
"Data is useless without context. Insight is useless without action.
Action is what creates value."
শেষ কথা—Data নিজে growth তৈরি করে না। Right decisions-ই আসল growth drive করে।
SA
সাকিব আহমেদ
ডেটা অ্যানালিস্ট
মে ১৮, ২০২৬
Data Analysis
Most Data Insights Come from Statistics—Not Dashboards
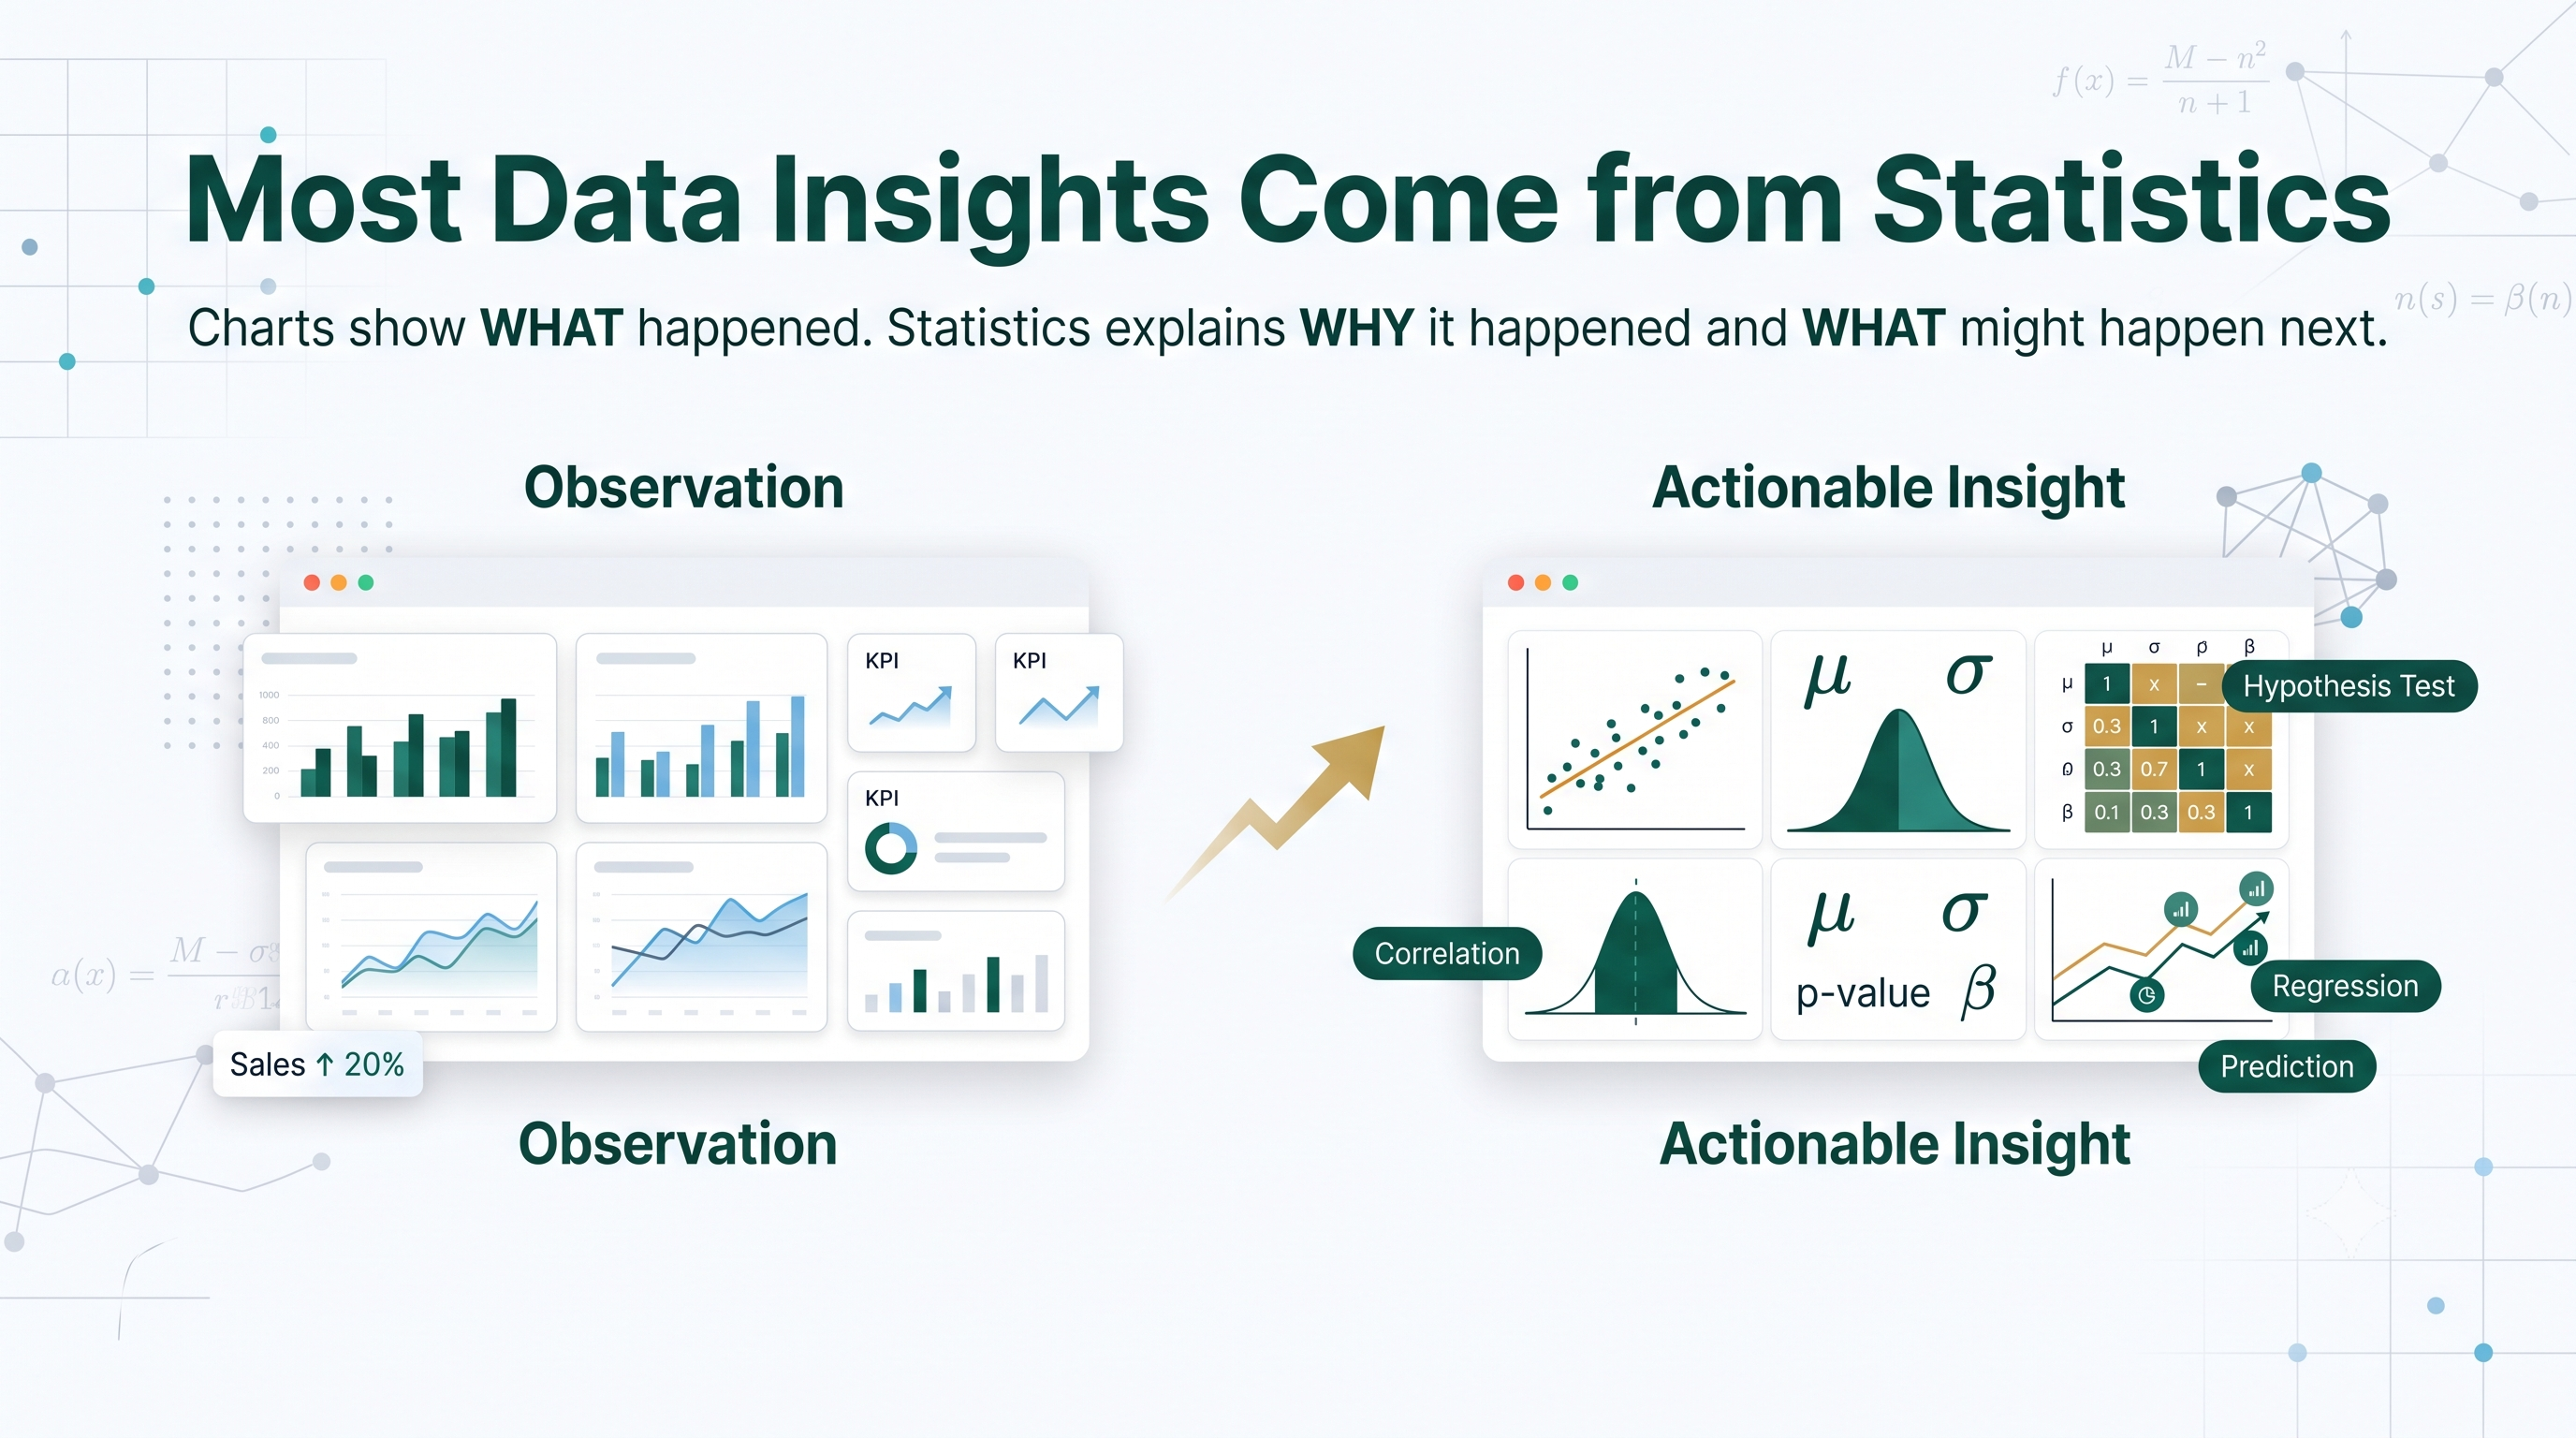
Many people think Data Analytics = Dashboards + Charts. While dashboards are essential, they're only part of the analytics process. A dashboard tells
you what happened, but statistics explains why it happened, whether it actually matters, and what is likely to happen next.That's what separates a report creator from someone who helps businesses make better decisions.
Imagine you're analyzing sales performance for an e-commerce company. The dashboard shows: "Sales increased by 20% this month." At first glance, this seems valuable,
but it's only an observation. The real questions are: Why did sales increase? Was it because of the recent discount campaign? Could it simply be random variation? If the discount increases,
will sales continue to grow? Which factors influence sales the most? Dashboards rarely answer these questions. Statistics does.
An analyst investigates further by performing a Correlation Analysis, which reveals a strong positive relationship between discounts and sales. However, correlation alone doesn't prove causation.
Next comes a Hypothesis Test (T-Test), confirming that the increase is statistically significant rather than occurring by chance. Finally, a Regression Model estimates how sales are expected to change for different discount levels.
Observation: "Sales increased by 20%."
Actionable Insight: "The discount campaign had a statistically significant impact on sales, and each
additional 5% discount is associated with an estimated increase in sales."
Consider another example. A food delivery company's dashboard reports that most orders occur during the evening. That's useful, but it's still
only an observation. Statistical analysis reveals that orders between 7 PM and 10 PM are significantly higher, delivery time has a strong positive correlation with cancellation rate, and every additional five minutes of delivery substantially increases the probability of cancellation.
Instead of simply reporting busy hours, the analyst recommends increasing riders during peak periods, positioning them in high-demand zones before demand spikes,
and optimizing delivery routes during the evening rush. These recommendations reduce cancellations, improve customer satisfaction, and increase revenue. That's the difference between reporting numbers and solving business problems.
Every organization asks questions like: Which marketing campaign actually works? Should we launch a new product? Why are customers leaving? Which variables influence
revenue the most? Can we predict future demand? Are these changes statistically significant or just random fluctuations? These aren't dashboard questions—they're statistical questions.
Learning Excel, SQL, Python, and Power BI is essential. But tools alone don't create
insights. Thinking does. To become an analyst who drives business
decisions, build a strong foundation in Hypothesis Testing, Probability,
Regression Analysis, Correlation Analysis, Statistical Inference,
Sampling Techniques, Experimental Design, and Statistical Thinking.
"Dashboards make information easier to consume. Statistics makes information trustworthy."
Without statistics, many business decisions rely on assumptions.
With statistics, decisions are supported by evidence.
The most valuable analysts aren't the ones who build the most beautiful dashboards;
they're the ones who can confidently answer three questions:
What happened?,
Why did it happen?, and
What should we do next?
Because in the end, most business insights don't come from charts—they come from statistics.
Why Data Analysts Should Think Like Business Owners
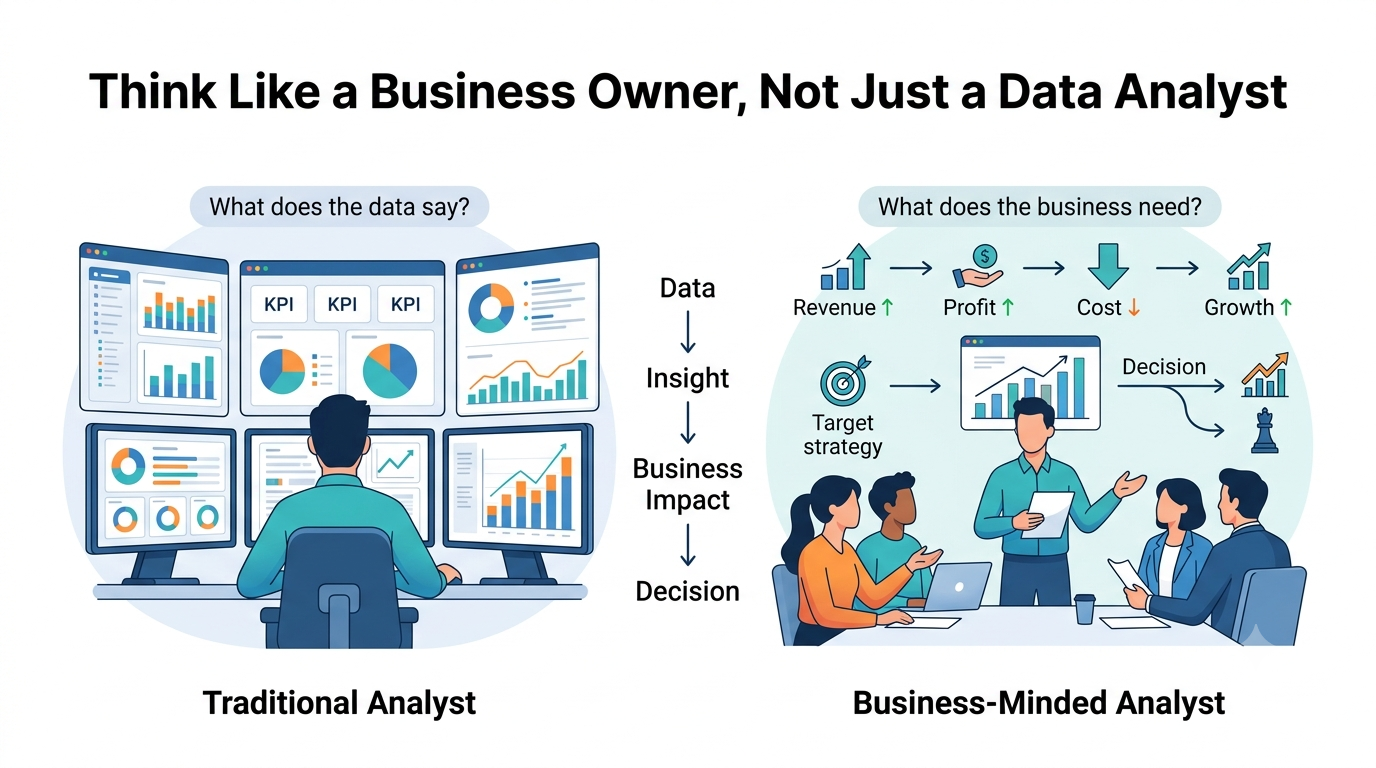
Most Data Analysts focus on one question:
"What does the data say?"
কিন্তু আসল impact আসে যখন প্রশ্নটা হয়:
"What does the business need?"
এখানেই report creator আর decision-maker-এর partner-এর মধ্যে পার্থক্য তৈরি হয়।
একটা common mistake হলো, অনেক analyst খুব clean dashboard, chart এবং KPI তৈরি করে।
সবকিছু technically ঠিক থাকে, কিন্তু business value clear থাকে না।
Data সুন্দরভাবে present করা আর business problem solve করা—এক জিনিস না।
একটা E-commerce company-তে একজন analyst প্রতি সপ্তাহে report দিতো।
সেখানে traffic, conversion rate এবং revenue সবকিছু perfectly organized ছিল।
কিন্তু একদিন CEO জিজ্ঞেস করলেন,
"Which part of the business is actually making or losing money?"
Analyst-এর report-এ সেই answer ছিল না। কারণ সে data দেখাচ্ছিল,
কিন্তু business perspective থেকে ভাবছিল না।
একই situation-এ একজন business-minded analyst একই data দেখে বুঝলো,
paid ads থেকে traffic বাড়ছে কিন্তু profit কমছে।
High revenue products-এর margin কম, আর কিছু customer segment loss generate করছে।
তাই recommendation ছিল low-margin campaign বন্ধ করে
high-margin products-এর উপর focus করা।
তখন data শুধু report নয়, business decision-এর driver হয়ে গেল।
আরেকটা সহজ example:
Data: "Sales এই মাসে 10% বেড়েছে।"
কিন্তু একজন business thinker বলবে,
"Sales 10% বেড়েছে, কিন্তু discount-এর কারণে profit 5% কমেছে।"
Now that's real insight.
Business মূলত কয়েকটি বিষয়কে সবচেয়ে বেশি গুরুত্ব দেয়: Revenue, Profit, Cost, Growth এবং Risk।
যদি আপনার analysis এই বিষয়গুলোর সাথে connect না করে,তাহলে সেটা খুব সহজেই ignore হয়ে যেতে পারে।
Framework to follow
Data → Insight → Business Impact → Decision
"Companies don't hire analysts just to analyze data.
They hire them to improve the business."
তাই mindset বদলান। শুধু "I found an insight." বলার পরিবর্তে ভাবুন, "I found something that can grow the business."
SA
সাকিব আহমেদ
ডেটা অ্যানালিস্ট
এপ্রিল ১২, ২০২৬
Data Analysis
Average Tells a Story. Distribution Tells the Truth.
One of the most common mistakes in data analysis is treating the average (mean) as the complete story. While average provides a quick summary, business decisions require much more context. Behind one
impressive average may be struggling customer segments, underperforming stores, or hidden operational risks. That's why experienced analysts never stop at the average—they explore the distribution behind it.
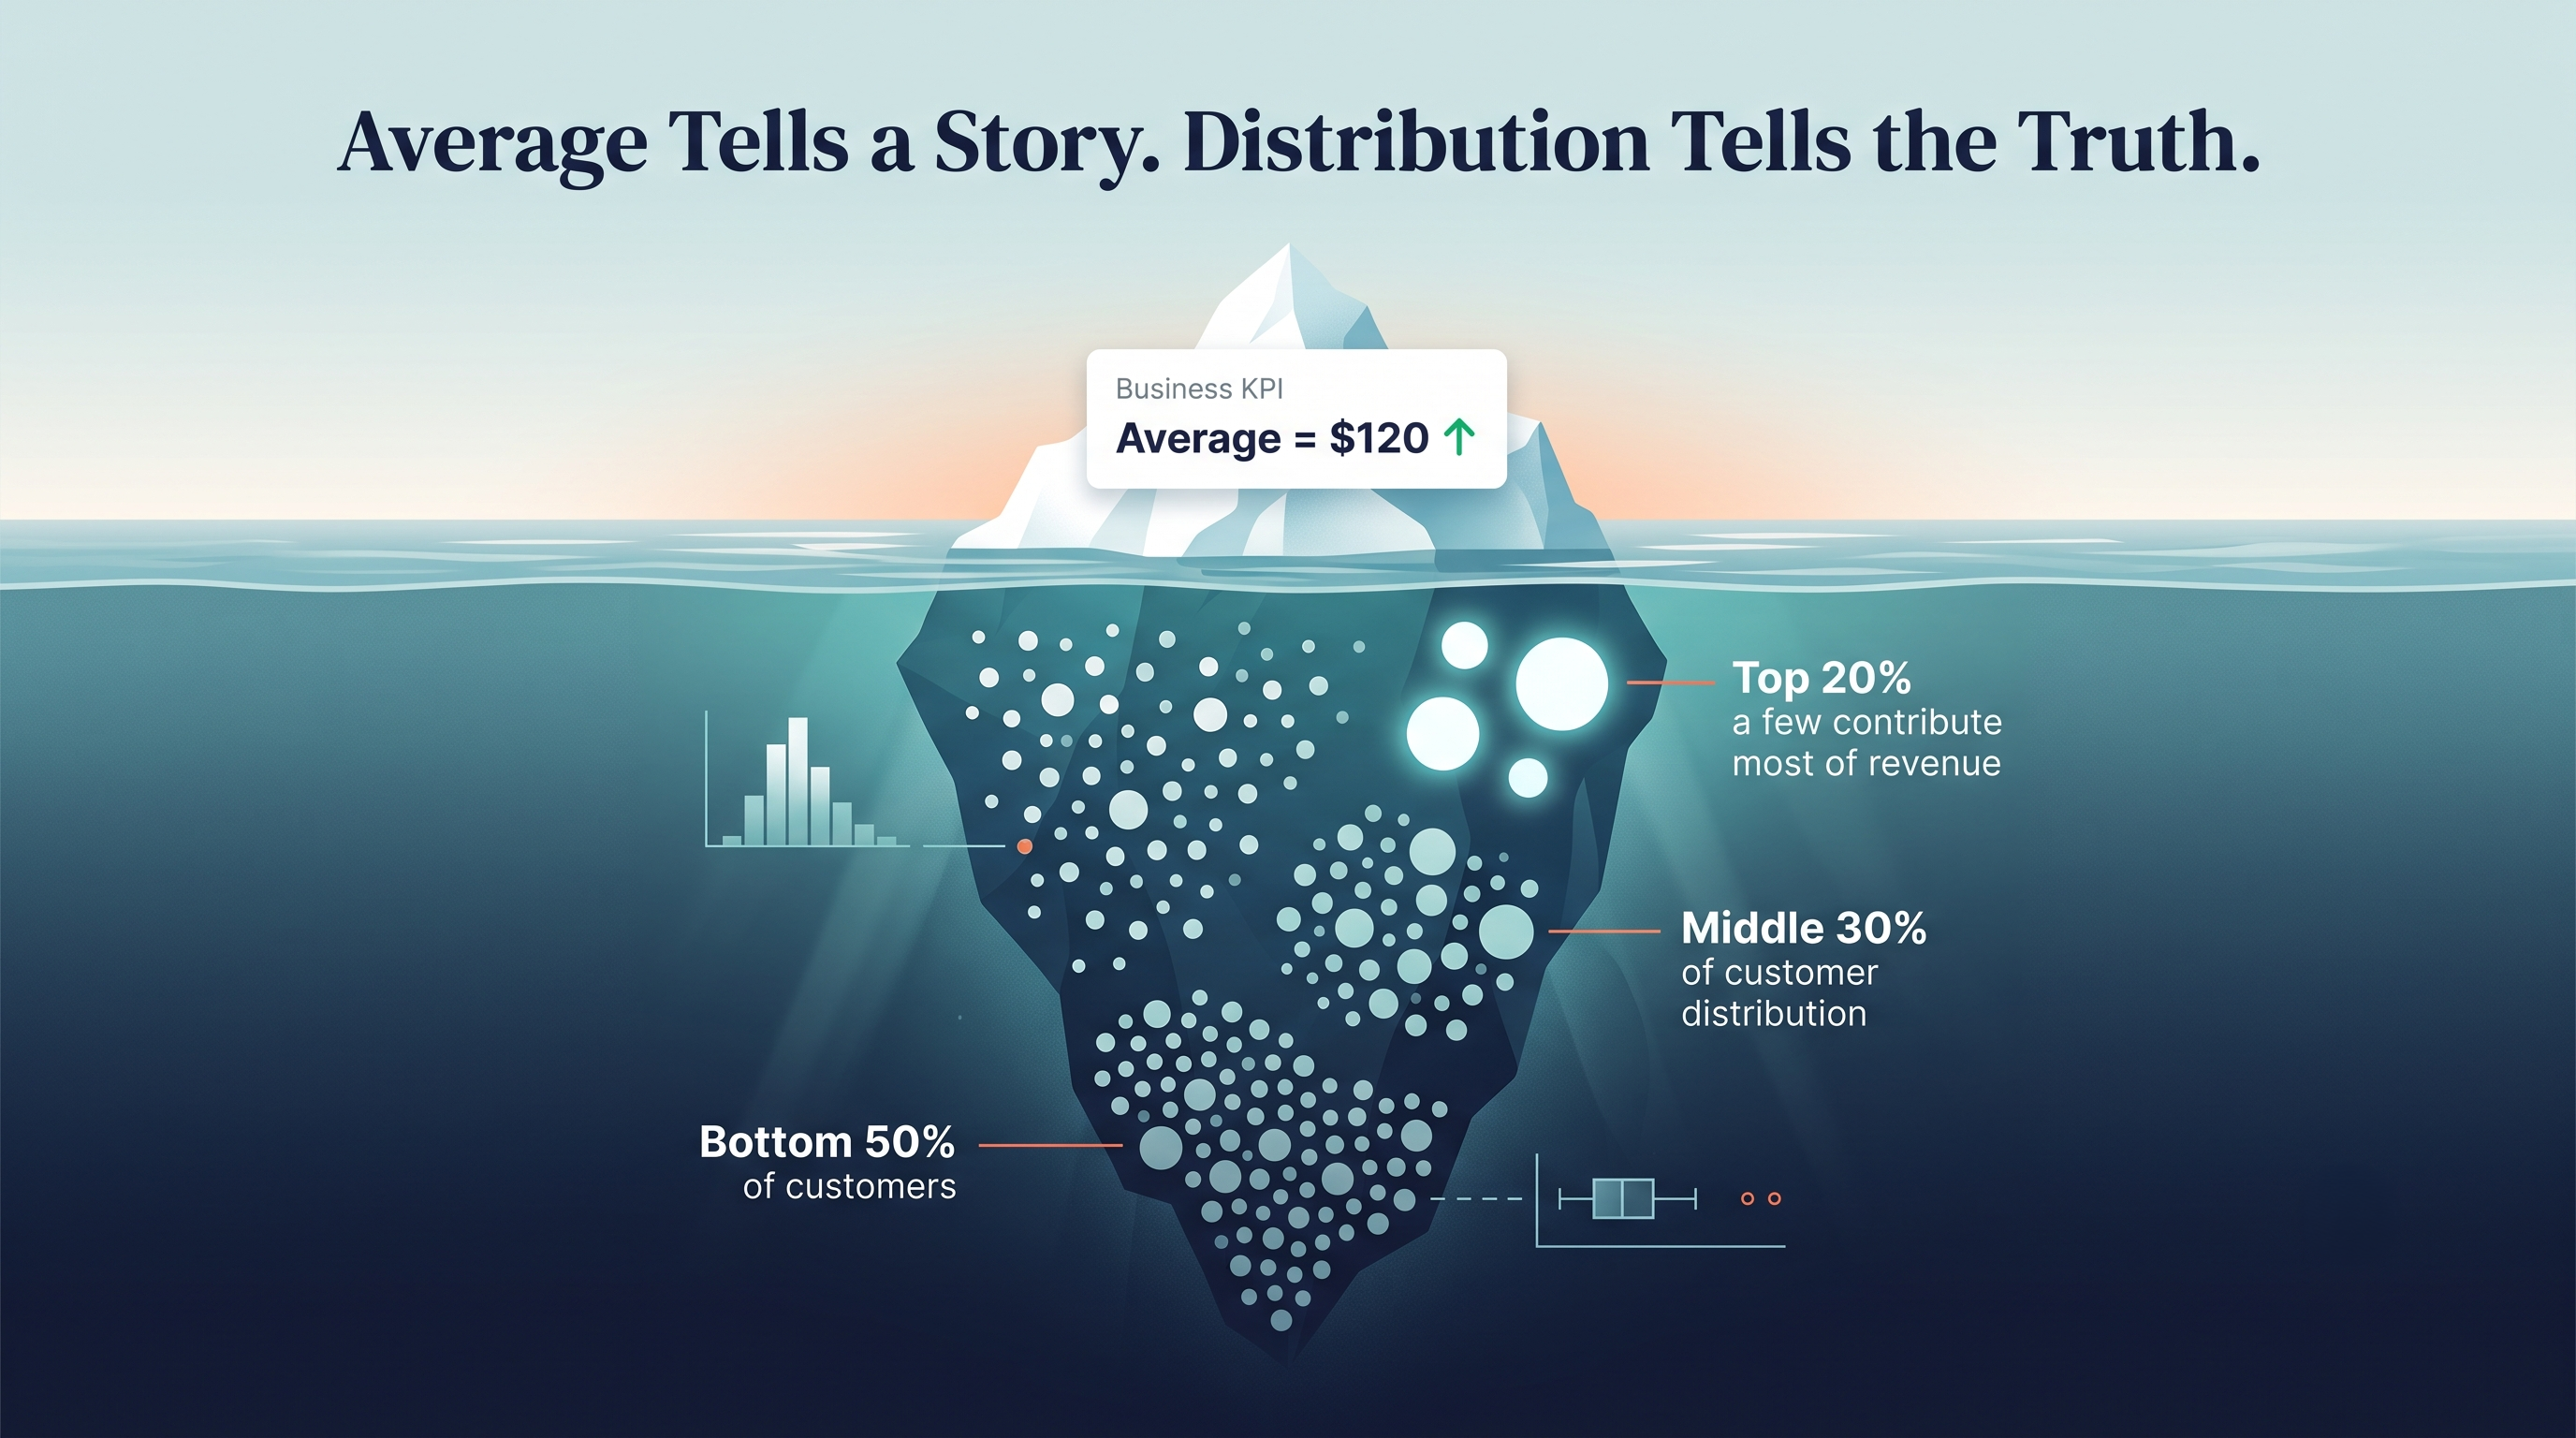
Imagine a company reports an average revenue of $120 per customer. At first, everything looks healthy. But distribution reveals a different picture: the top 20% of customers generate around $400 each, the middle 30%
generate about $90, while the bottom 50% contribute only $30. The average isn't wrong—it simply hides the fact that a small group of customers is driving most of the revenue.
A similar situation occurred in a SaaS business where monthly reports showed that the average subscription value kept increasing. Leadership celebrated the growth until a deeper segment analysis uncovered the real story.
Enterprise customers were upgrading rapidly, mid-market customers remained relatively unchanged, and small businesses were cancelling subscriptions at a growing rate. The company wasn't just growing—it was becoming increasingly dependent on a small number of high-value clients.
Retail businesses face the same challenge. An average store revenue of $50,000 may appear consistent, yet a closer look might reveal that only a handful of stores generate exceptional sales while several
others struggle. Without analyzing the distribution, management could easily overlook stores that need operational improvements, marketing support, or inventory optimization.
What can averages hide?
• Underperforming customer segments
• Weak geographic regions
• Product categories losing profitability
• Operational bottlenecks
• High customer churn risk
• Revenue concentration in only a few clients
Strong analysts go beyond summary metrics. They ask questions such as: How is the data distributed? Are there outliers? Which customer segments are driving performance? Is the business becoming more or less
stable? These questions reveal opportunities and risks that a single average can never explain.
Instead of relying on one metric, experienced analysts combine distribution, median vs. mean, segment-wise analysis, outlier detection, variance, standard deviation, and
percentiles. These measures don't replace the average—they provide the context that makes the average meaningful.
"Average summarizes the data. Distribution explains it."
Whenever you see an average, ask yourself: "What is this number hiding?" The most valuable business insights are often found not in
the average itself, but in the variation around it. That's the difference between reporting numbers and helping businesses make better decisions.
Feb 17, 2026
Data Analysis
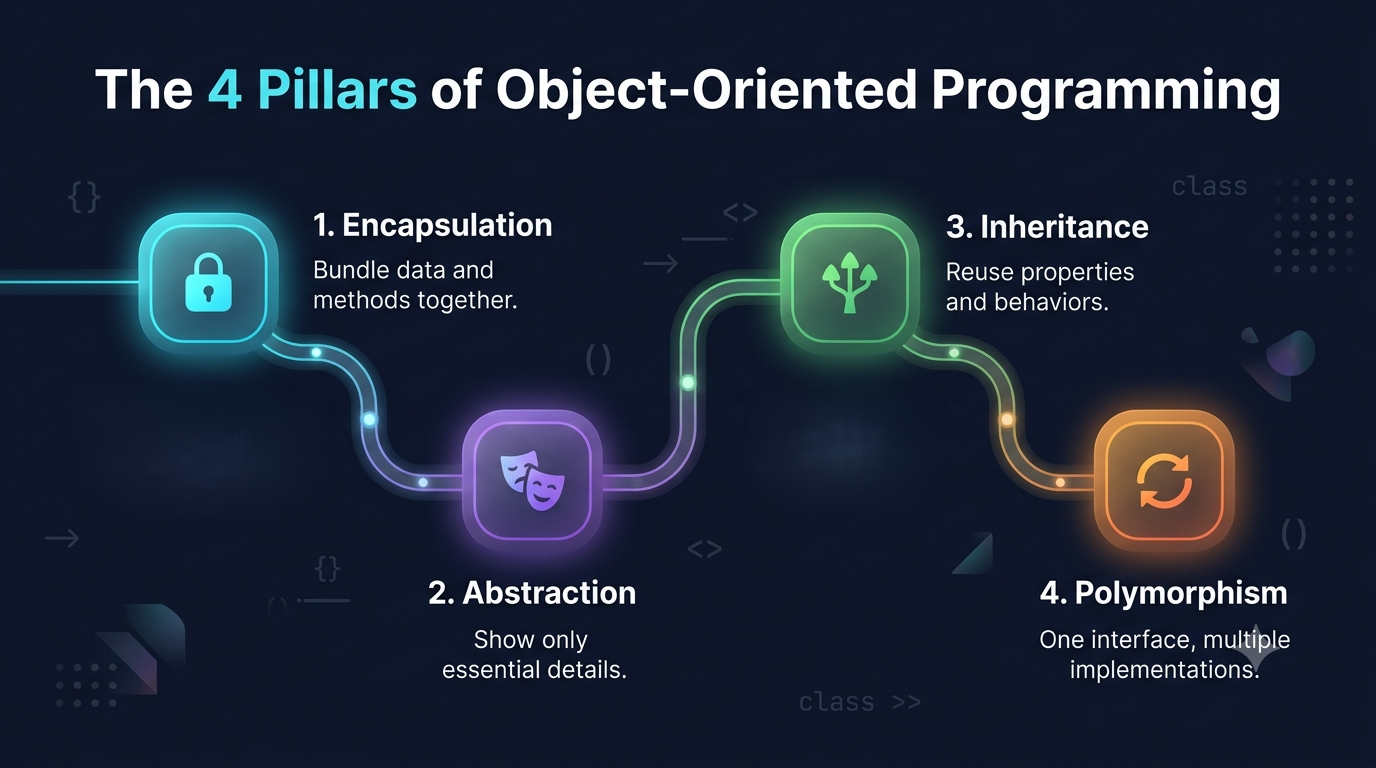
The 4 Pillars of Object-Oriented Programming (OOP)
If you've just started learning programming, you've probably heard this sentence:
"Understand the four pillars of OOP, and you'll become a better developer." The reality is much simpler than many tutorials make it seem. OOP isn't just a programming concept—it's a way of organizing code so it's easier to
understand, maintain, and reuse.
What is Object-Oriented Programming (OOP)?
Object-Oriented Programming (OOP) is a programming paradigm where software is built using objects. Each object combines
data (attributes) and behavior (methods) into a single unit. Instead of writing one long block of code, OOP divides programs into reusable, organized, and maintainable components. Popular OOP languages include Java, C++, C#, Python, Kotlin, and Swift.
The Four Pillars of OOP
Every object-oriented language is built around four fundamental principles:
- Encapsulation
- Abstraction
- Inheritance
- Polymorphism
1. Encapsulation
Definition: Encapsulation keeps an object's data and the methods that operate on it together while restricting direct access to sensitive information.
Everyday Example: An ATM lets you withdraw money or check your balance, but it doesn't allow you to access the bank's internal database.
Programming Example: A BankAccount class exposes methods like deposit(),
withdraw(), and getBalance() instead of allowing direct modification of the account balance.
Real-World Usage: Banking systems, authentication, healthcare applications, and e-commerce payment systems.
2. Abstraction
Definition: Abstraction hides unnecessary implementation details while exposing only the features users need.
Everyday Example: When driving a car, you use the steering wheel, accelerator, and brakes without understanding how the engine works.
Programming Example: A
pay(amount) method can process payments through different gateways while hiding the internal implementation.
Real-World Usage: Mobile apps, payment gateways, cloud services, APIs, and software libraries.
3. Inheritance
Definition: Inheritance allows one class to inherit properties and methods from another, promoting code reuse and reducing duplication.
Everyday Example: Children inherit characteristics such as eye color or height from their parents.
Programming Example: A
Vehicle class can provide common properties like speed, color, and fuel type, while Car, Bike, and Truck extend it with their own features.
Real-World Usage: Employee management systems, vehicle management software, games, and educational platforms.
4. Polymorphism
Definition: Polymorphism means "many forms." The same method or interface can behave differently depending on the object using it.
Everyday Example: A remote control's power button works for a TV, air conditioner, or projector, but each device performs a different internal action.
Programming Example: Different classes implement the same draw() method, but each object draws a different shape such as a circle, rectangle, or triangle.
Real-World Usage: Graphic design software, game engines, plugin systems, notification services, and payment processing platforms.
Why Are These Four Pillars Important?
Together, these principles help developers build software that is easier to maintain, more secure, reusable, scalable, less repetitive, and easier to
test. Without them, large software projects quickly become difficult to manage.
"Good software isn't just about writing code. It's about designing code that can grow, adapt, and remain easy to understand."
Final Thoughts
Learning the four pillars of OOP is more than preparing for interviews or passing programming courses. These principles shape how modern software is designed. Whenever you're building an application, ask yourself:
- Is my data protected? (Encapsulation)
- Am I hiding unnecessary complexity? (Abstraction)
- Can I reuse existing code? (Inheritance)
- Can different objects share the same interface? (Polymorphism)
If the answer is "Yes", you're already thinking like an object-oriented programmer. Master these four pillars, and you'll write cleaner, more maintainable, and scalable software.
SA
Sakib Ahmed
Software Engineering Student
May 15, 2026
Programming
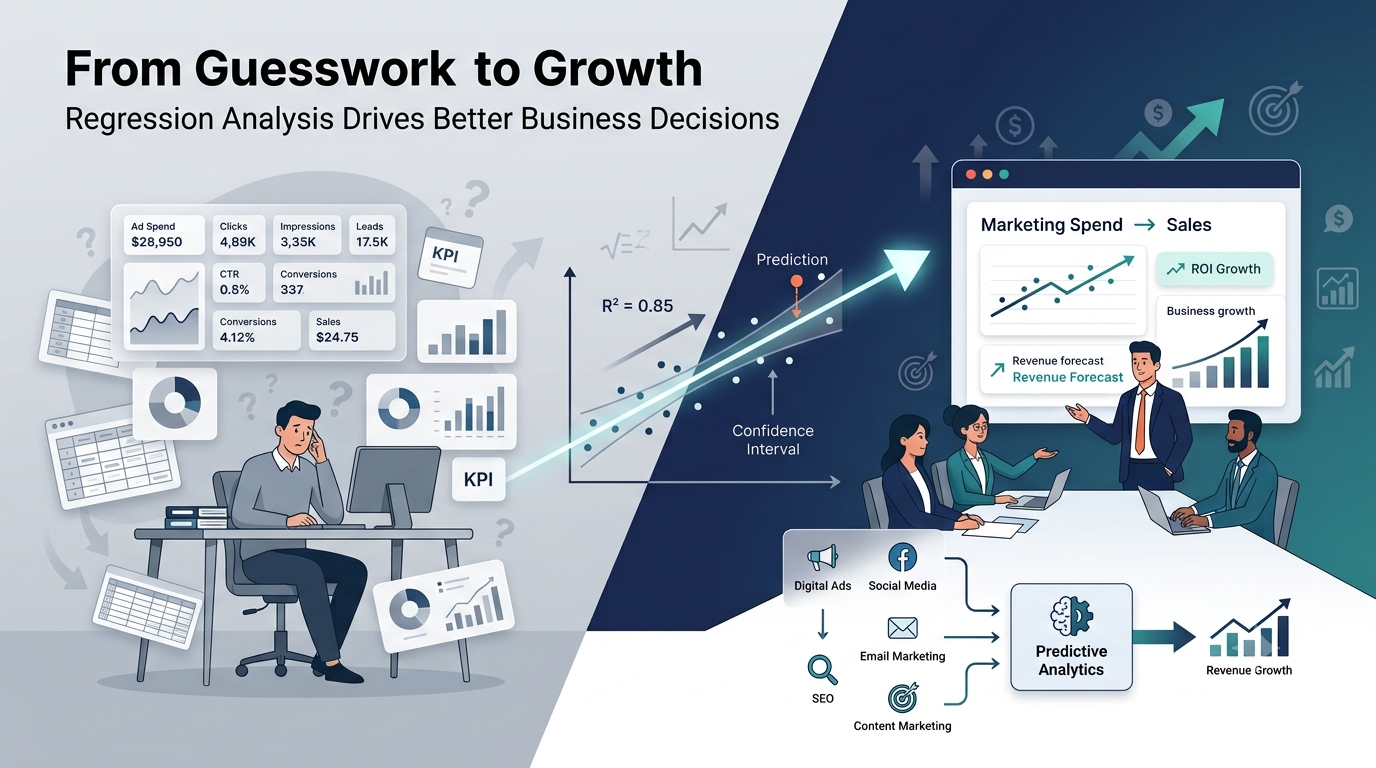
From Guesswork to Growth: How Regression Analysis Turns Marketing Data into Business Decisions
Have you ever opened a spreadsheet filled with marketing spend, impressions, clicks, leads, and sales, only to wonder: "Which marketing channel is actually driving revenue?" It's a common challenge. Businesses invest thousands of dollars in digital advertising, social media campaigns, SEO, email marketing, influencer collaborations, and trade shows, yet many still struggle to identify which channels deliver the highest ROI, whether increasing ad spend is profitable, how efficiently their budget is being used, which channels deserve more investment, and whether future sales can be predicted. Having data doesn't automatically provide answers. This is where Data Analysis becomes more than reporting—it becomes decision-making.
Recently, I worked with a client facing exactly this challenge. Their company invested in Digital Ads, Content Marketing, Social Media Campaigns, Email Marketing, and Trade Shows while tracking KPIs such as Marketing Spend, Website Visitors, Leads, Conversion Rate, Customer Acquisition Cost, Revenue, and Sales. Although the dashboard looked impressive, management asked, "If we increase our digital advertising budget by $10,000 next month, how much additional revenue should we expect?" No one could answer confidently. They had descriptive analytics but needed diagnostic analytics to understand why results happened and predictive analytics to estimate what could happen next. The solution was Regression Analysis.
Step 1: Understanding the Data with Exploratory Data Analysis (EDA)
Before building any predictive model, we first explored the data through EDA. We cleaned missing values, removed duplicate records, identified outliers, checked distributions, created summary statistics, and built visualizations. A scatter plot comparing Digital Ad Spend and Sales Revenue showed a clear upward trend. As advertising spend increased, sales generally increased as well, suggesting a positive linear relationship and giving us confidence to proceed with Linear Regression.
Step 2: Building the Regression Model
Regression helps quantify relationships instead of relying on assumptions. Rather than saying, "Sales seem to increase with advertising," regression tells us exactly how much sales increase for every additional dollar invested. Our model was: Sales = Intercept + (Coefficient × Digital Ad Spend). Using historical marketing data, the algorithm calculated the best-fit line that minimized prediction errors, providing a mathematical model based on real business evidence.
Step 3: Interpreting the Results
After training the model, we obtained the equation: Sales = $50,000 + ($5.20 × Digital Ad Spend). The Intercept ($50,000) represents baseline sales generated even without digital advertising, such as revenue from repeat customers, referrals, organic traffic, or existing contracts. The Coefficient ($5.20) tells us that every additional $1 invested in digital advertising generates approximately $5.20 in sales on average. Instead of saying, "Let's spend more because it feels right," the conversation becomes, "Historical data suggests each additional marketing dollar generates $5.20 in revenue." That's data-driven decision-making.
Step 4: Validating the Model
A predictive model is only valuable if it can be trusted. Our model achieved an R² score of 0.85, meaning 85% of the variation in sales could be explained by digital advertising spend. We also evaluated the p-value, which was well below the accepted significance threshold, confirming that the relationship between advertising spend and sales was statistically significant rather than random. Model validation ensures businesses make investment decisions using reliable evidence.
Step 5: Making Predictions
Now we could answer the original business question. If the company invested an additional $10,000 in digital advertising, the regression equation estimated: Additional Sales = $5.20 × $10,000 = $52,000. Instead of relying on guesswork, the company now had a realistic revenue estimate backed by historical data. While every prediction includes uncertainty, it is significantly more reliable than intuition alone.
Business Impact
The true value of regression analysis wasn't the equation itself—it was the quality of business decisions it enabled. The client could now predict future revenue, optimize budget allocation, improve marketing ROI by reducing spending on underperforming campaigns, forecast growth with greater confidence, and present data-backed recommendations to executives and stakeholders.
Why Regression Matters
Regression analysis extends far beyond marketing. It helps answer questions such as how house prices change based on location and size, how product pricing affects demand, whether customer lifetime value can be predicted, how employee experience influences salary, how weather impacts retail sales, and which factors contribute most to customer churn. In every case, regression transforms raw data into measurable business insight.
"Descriptive analytics tells us what happened. Diagnostic analytics explains why it happened. Regression analysis helps predict what is likely to happen next."
Many organizations already collect enormous amounts of data, but the real challenge is extracting meaningful insights that improve decisions. Businesses don't grow because they have more dashboards—they grow because they make better decisions. Regression analysis provides the evidence needed to make those decisions with confidence.
Sep 10, 2025
Data Analysis